
Define the context
Choose the symbol, timeframe, and comparison window that match the question you want to investigate.
Compare current crypto charts with historical windows, review how matched scenarios unfolded, and keep your financial records organized in focused AmarDeFi workspaces.
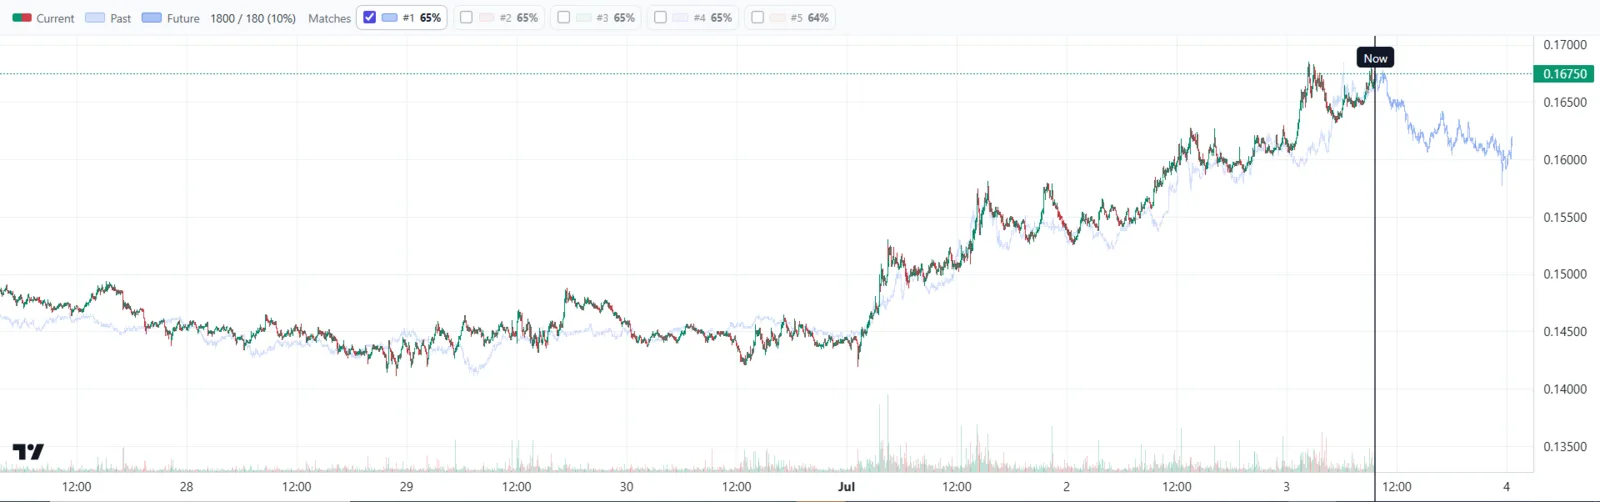
Use a central AmarDeFi account to access the chart workspace and account-enabled services.
A transparent workflow
Keep the inputs visible, examine more than one historical analogue, and treat the resulting paths as scenarios rather than certainty.
Choose the symbol, timeframe, and comparison window that match the question you want to investigate.
Inspect several similar windows, including the places where their shapes and conditions diverge.
View subsequent paths as a distribution of historical scenarios and apply independent risk limits.
The AmarDeFi suite
Each workspace is designed around a specific financial task, with public product information before you open the application.
Historical chart similarity, matched-window review, and subsequent-path comparison for crypto market research.
A structured workspace for accounts, balanced debit-and-credit entries, and financial reporting.
Responsible interpretation
A historical match describes resemblance under selected settings. It cannot know every difference in liquidity, volatility, participants, news, or market structure.
Research library
Evergreen explanations of chart comparison, research limitations, double-entry records, reconciliation, and trial balance.

A quantitative framework for lookback window calibration in algorithmic chart pattern matching, analyzing the bias-variance tradeoff, subsequent path variance decay, and multi-window architectures across market regimes.
Read guide
A chart price and a smart contract’s oracle input can differ for valid reasons—or because of stale, thin, or distorted data. Learn how to inspect the feed, its timing, and the evidence before drawing conclusions.
Read guide
A quantitative guide to probabilistic price path forecasting using historical candlestick analogs. Discover how empirical quantile bands, bimodal path clustering, and Maximum Adverse Excursion (MAE) envelopes replace misleading single-line fractals with calibrated risk distributions.
Read guideQuestions, answered
Transparency matters for finance-adjacent products. Start here, then review the product pages and disclosure before use.
No. Chart Prediction compares selected charts with historical windows and shows scenario paths. Similarity cannot guarantee direction, price, timing, or profit.
No. The products and articles provide tools and general educational information. Decisions, classifications, and reporting obligations require your own judgment and, where appropriate, a qualified professional.
It supports account organization, balanced debit-and-credit entries, and reports such as statements and trial balance. Public product information does not claim automated tax filing or exchange integrations.
Use the support button on this page or email info@amardefi.com. Never send a password or private wallet key in a support message.
Contact AmarDeFi
Reach the team through the built-in support channel or send a message from your verified email address.