
Choose the research settings
Select a symbol, timeframe, and comparison context. Consistent inputs make results easier to interpret and revisit.
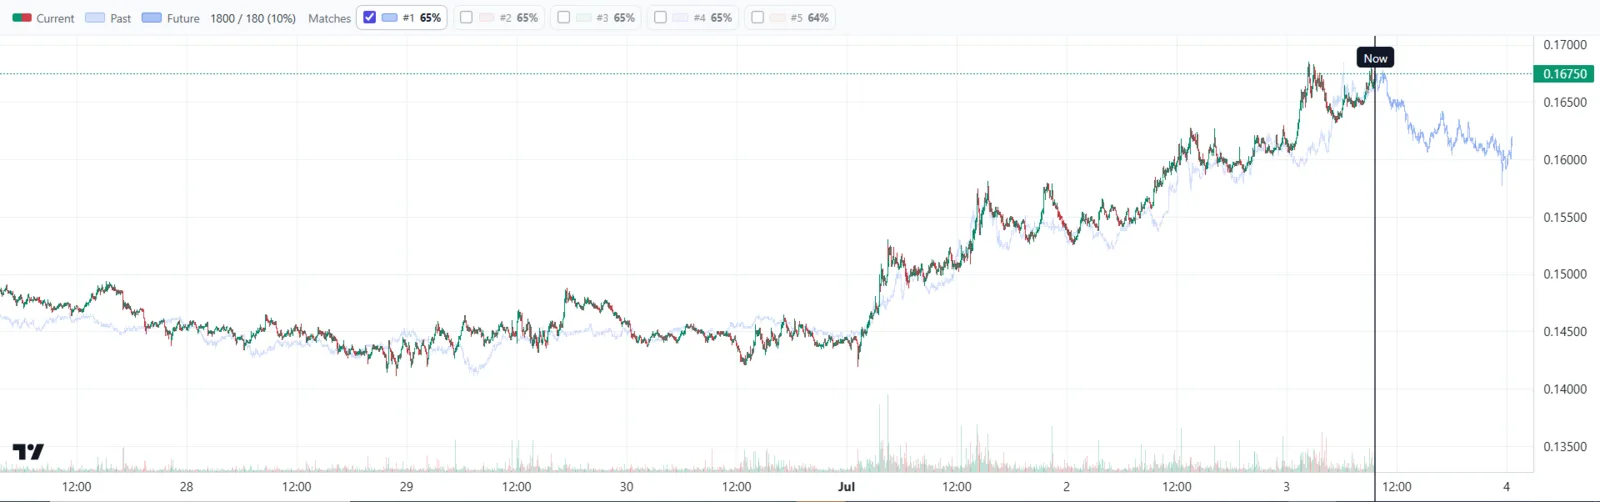
AmarDeFi Chart Prediction helps you compare a selected crypto chart with historical windows and examine the range of paths that followed those matches.
How it works
Set a clear question, examine several analogues, then interpret later paths as historical scenarios.
Select a symbol, timeframe, and comparison context. Consistent inputs make results easier to interpret and revisit.
Review ranked windows and their overlays. Note both the similarities and where the market structures stop aligning.
Look at the range and dispersion of what followed. Do not turn one historical outcome into a forecast promise.
Workspace capabilities
The interface keeps chart selection, historical matches, overlays, and scenario paths together so you can review the evidence behind an analogy.
Limitations first
Different liquidity, volatility, participants, events, and market structure can make a familiar chart unfold differently. Review counterexamples, document settings, and set risk independently.
Read risk disclosureProduct FAQ
No. It ranks resemblance under selected settings; it is not a probability that a later price path will repeat.
No timeframe is universally best. Choose one that fits the research horizon and keep comparisons consistent.
No. Several matches, including contradictory outcomes, provide a more honest view of historical variation.
The public Chart Prediction workflow is presented as a research and decision-support workspace, not a promise of execution or results.
Open the workspace, define the comparison settings, and keep the limitations visible.