
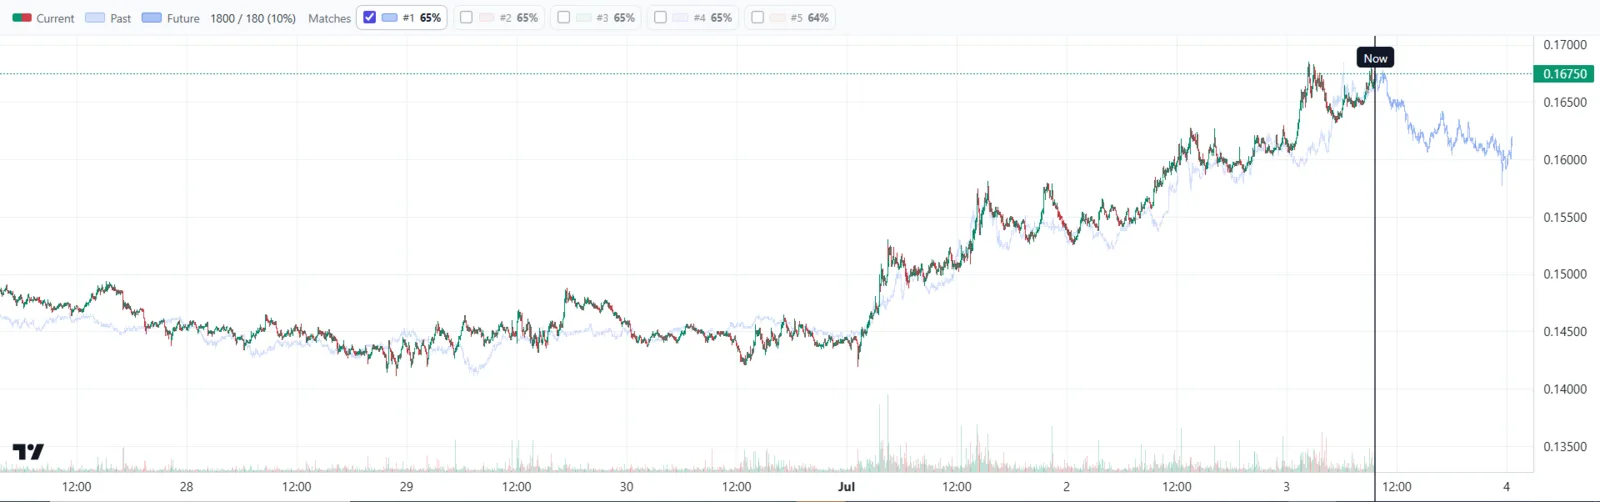
AmarDeFi Chart Prediction is a research workspace for comparing a selected crypto chart with similar historical windows and reviewing how those earlier scenarios developed. Its purpose is to organize evidence and possible paths—not to promise a future price, recommend a trade, or replace independent risk controls.
Start with a defined chart question
A useful comparison begins before the search button is pressed. Select the symbol and timeframe that match the question you are investigating, then choose enough context to represent the market structure you want to compare. Changing any of those settings changes the research problem. A short intraday window can emphasize local noise, while a longer window can capture a broader cycle but smooth over smaller turns.
Consistency matters more than finding a setting that produces an attractive result. If you change the window, timeframe, or selection rules after seeing the matches, record that change and treat it as a new test. The guide to crypto chart timeframes explains why the same market can look materially different across intervals.
Review more than the top historical match
The closest match is only the first candidate under the selected settings. It is not a confidence percentage and does not mean history is about to repeat. Inspect several matches, note where their shapes agree, and identify the points where they diverge. A collection of varied matches is often more informative than a single near-perfect overlay because it exposes the range of historical behavior.
Also check whether several results come from nearly the same historical episode. Closely overlapping windows can make one event appear to be repeated evidence. A disciplined review keeps counterexamples visible and avoids discarding matches only because their later path is inconvenient.
Compare subsequent paths as scenarios
After reviewing the matched portions, the future-path view shows what happened after those historical windows. Think of those paths as a scenario set. If they cluster, that is a property of the selected historical sample—not a guarantee. If they spread widely, the dispersion is useful evidence that similar-looking setups previously led to different outcomes.
A neutral workflow asks: What outcomes appear in the set? How quickly do paths diverge? Which conditions would invalidate the original analogy? What risks are absent from the chart alone? The article on chart similarity versus price prediction explores this distinction in more depth.
A simple review routine
- Write down the symbol, timeframe, context, and reason for the review.
- Inspect multiple historical matches and retain contradictory examples.
- Compare the range of subsequent paths without converting them into a promise.
- Record what would make the comparison no longer relevant.
- Apply independent position, loss, and liquidity limits outside the match result.
This routine makes the research easier to revisit and reduces the temptation to remember only successful analogies. For a reusable version, see the crypto chart scenario review checklist.
Limitations to keep visible
Markets are adaptive systems. Participants, liquidity, volatility, news, market structure, and regulation can change between the historical period and the present. A shape comparison cannot capture every causal difference. Data quality, the chosen window, normalization, candidate universe, and selection rules also affect which matches appear.
AmarDeFi Chart Prediction should therefore be used as decision support. It does not provide personalized financial advice and does not guarantee accuracy, profit, or protection from loss. Read the risk disclosure before using market-research features.
Frequently asked questions
Does a high similarity result predict the next price move?
No. Similarity describes a relationship between selected historical windows. The later outcome remains uncertain.
Why should I review several matches?
Multiple matches reveal dispersion and counterexamples that a single selected chart can hide.
Can the workspace decide a position size?
No chart analogy should determine personal risk. Position and loss limits require separate judgment and circumstances.
Where can I learn the research workflow?
Start with the historical chart pattern matching guide and the scenario-review checklist.
Editorial note: This article is general educational information, not personalized financial, accounting, tax, or legal advice. Product capabilities and obligations can change; verify current facts and consult a qualified professional where needed.