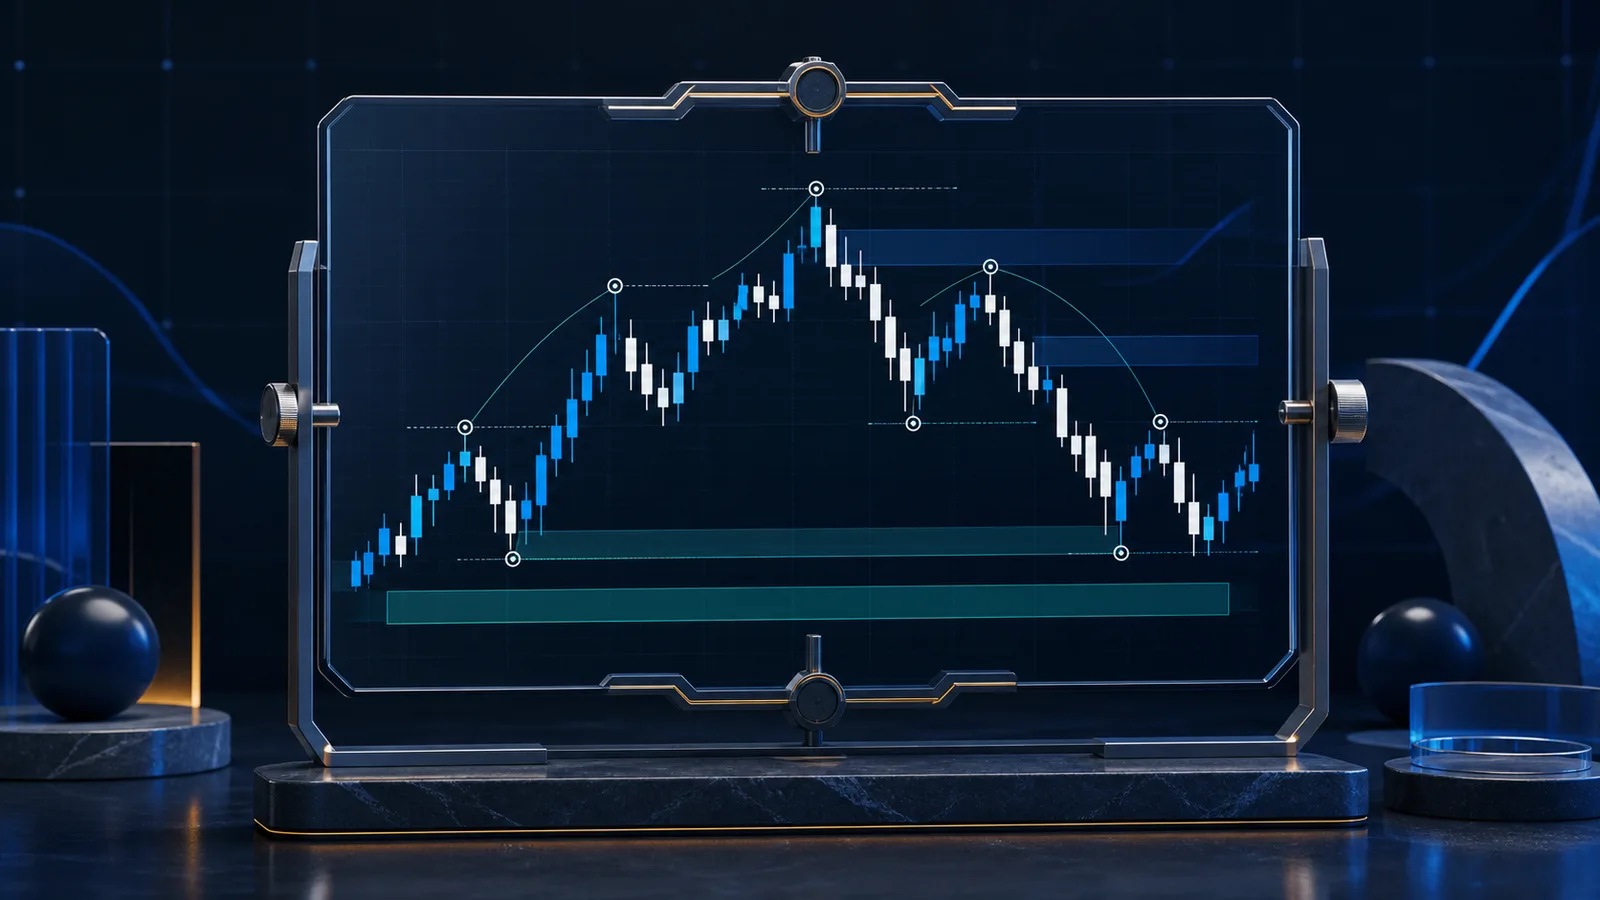
Historical chart pattern matching is a research method that compares the shape of a recent price sequence with earlier sequences after putting them on a comparable scale. It can help an analyst find analogues, test a market narrative, and ask better questions. It does not establish that the next move will repeat, and it should not be treated as a prediction or trading instruction.
What historical chart matching actually means
A chart can look familiar because it rises, falls, pauses, and changes volatility in a recognizable order. A systematic comparison turns that visual impression into a repeatable question: which earlier windows most closely resemble the selected query window under a stated set of rules?
The query might be the latest 60 daily closes for one asset. The historical library might contain rolling 60-day windows from the same asset or a defined group of assets. Before comparing them, the series can be normalized so that a token priced at 0.50 and another priced at 20,000 are evaluated by shape rather than nominal level. Common representations include percentage change from the first observation, indexed values that begin at 100, or standardized values measured around each window's own average.
These choices matter. Close-only data answers a different question from candlestick ranges. A 30-point window answers a different question from a 180-point window. Matching within one asset can preserve more consistent market mechanics, while searching across assets can produce a broader but less comparable set. A useful result therefore includes its research definition, not merely two charts placed side by side.
How to prepare a fair comparison
Start by writing a small research specification. Name the asset universe, data interval, window length, field being compared, normalization method, and whether overlapping matches are allowed. This prevents the rules from drifting after an appealing result appears.
- Use consistent observations. Compare daily data with daily data or four-hour data with four-hour data. Align candle boundaries and handle missing observations consistently.
- Normalize each window. Raw price distance is usually dominated by scale. Indexing each sequence to the same starting value makes the path easier to compare.
- Separate search from evaluation. Use the query period to find analogues, then inspect the later period only after matches are selected. Looking ahead during selection creates hindsight bias.
- Reduce duplicates. Adjacent rolling windows can describe almost the same episode. Grouping heavily overlapping results prevents one historical event from filling the entire shortlist.
- Keep metadata. Record dates, asset, interval, transformation, distance measure, and exclusions so another person can reproduce the comparison.
If interval choice is unclear, the guide to crypto chart timeframes explains how candle duration changes the question being studied.
How to read a match result responsibly
A similarity score ranks candidates under one definition; it is not a probability of a future outcome. Two sequences may receive a close score because their broad direction matches even though their volatility, drawdowns, or turning points differ. Review the overlaid normalized paths and ask where the match is strong and where it breaks.
Inspect a set of neighbours rather than only the top result. If several independent periods share a similar lead-in but their later paths vary widely, the honest conclusion is that the setup had multiple historical resolutions. That dispersion is useful information. Conversely, a visually striking single match among many weak candidates may be a product of chance, especially after searching a large library.
Context should be recorded separately from shape. Market liquidity, asset age, trading venue coverage, volatility regime, and the broader market direction can affect comparability. Context filters can make the sample more coherent, but every added filter reduces the number of examples. State the trade-off rather than adjusting filters until the preferred outcome appears.
Worked example: comparing a 40-day window
Suppose a researcher selects 40 daily closing prices for Asset A. The series starts at 50, rises to 58, falls to 53, and finishes near 61. Each observation is divided by the first close and multiplied by 100, so the query begins at 100. The same transformation is applied independently to every eligible 40-day historical window.
A distance calculation returns five non-overlapping candidates. Match 1 follows the early rise closely but has a shallower pullback. Match 2 reproduces the pullback but reaches its second high earlier. Matches 3 through 5 are less visually close yet still rank better than the rest of the library. Only after fixing that shortlist does the researcher open the next 20 daily observations for each historical case.
Two subsequent windows rise, two move sideways, and one declines. This example does not support a single directional claim. It supports a narrower observation: the selected 40-day shape has appeared before, while the paths that followed were mixed. The researcher could then compare volatility, maximum adverse movement, and broader market conditions, clearly labeling that work as exploratory. For a deeper distinction between the evidence and the conclusion, see chart similarity versus price prediction.
Limitations and quality checks
Historical databases contain survivorship issues, inconsistent venue histories, missing candles, extreme prints, and assets that no longer trade. Cleaning choices can change the ranking. Normalization can also hide meaningful differences in absolute volatility or liquidity. A method that emphasizes point-by-point distance may miss a shifted turning point, while a method tolerant of timing shifts may pair sequences whose real durations differ.
Multiple testing is another central limitation. The more assets, window lengths, transformations, and metrics explored, the greater the chance of finding something that looks exceptional by coincidence. Keep a research log, report the size of the search space, test stability under small parameter changes, and preserve unflattering results. Avoid judging a method solely on examples chosen after their outcomes are known.
Historical prices alone do not encode every condition that influences a market. A comparison should sit alongside independent research and risk controls appropriate to the reader's situation. AmarDeFi's Chart Prediction research product can help you explore historical chart comparisons; use its outputs as starting points for investigation, not promises about what a market will do.
Frequently asked questions
Does a close historical match mean the future will repeat?
No. The match describes similarity within the selected historical window. Conditions after that window can differ, and even very similar lead-in patterns may have different subsequent paths.
Should I compare raw prices or normalized prices?
Normalized values are generally more suitable when the goal is to compare shape across different price levels. Raw values can still matter when absolute price distance is part of the specific research question.
How many historical matches should I review?
There is no universal number. Review enough distinct matches to see variation, remove near-duplicates from the same episode, and disclose the selection rule. A shortlist is more informative when it includes both strong and imperfect analogues.
Can pattern matching be used on intraday charts?
Yes, provided observations are aligned and data quality is adequate. Intraday analysis is more sensitive to venue differences, missing intervals, candle boundaries, and short-lived noise, so conclusions should be correspondingly cautious.
Editorial note: This article is general educational information, not personalized financial, accounting, tax, or legal advice. Product capabilities and obligations can change; verify current facts and consult a qualified professional where needed.