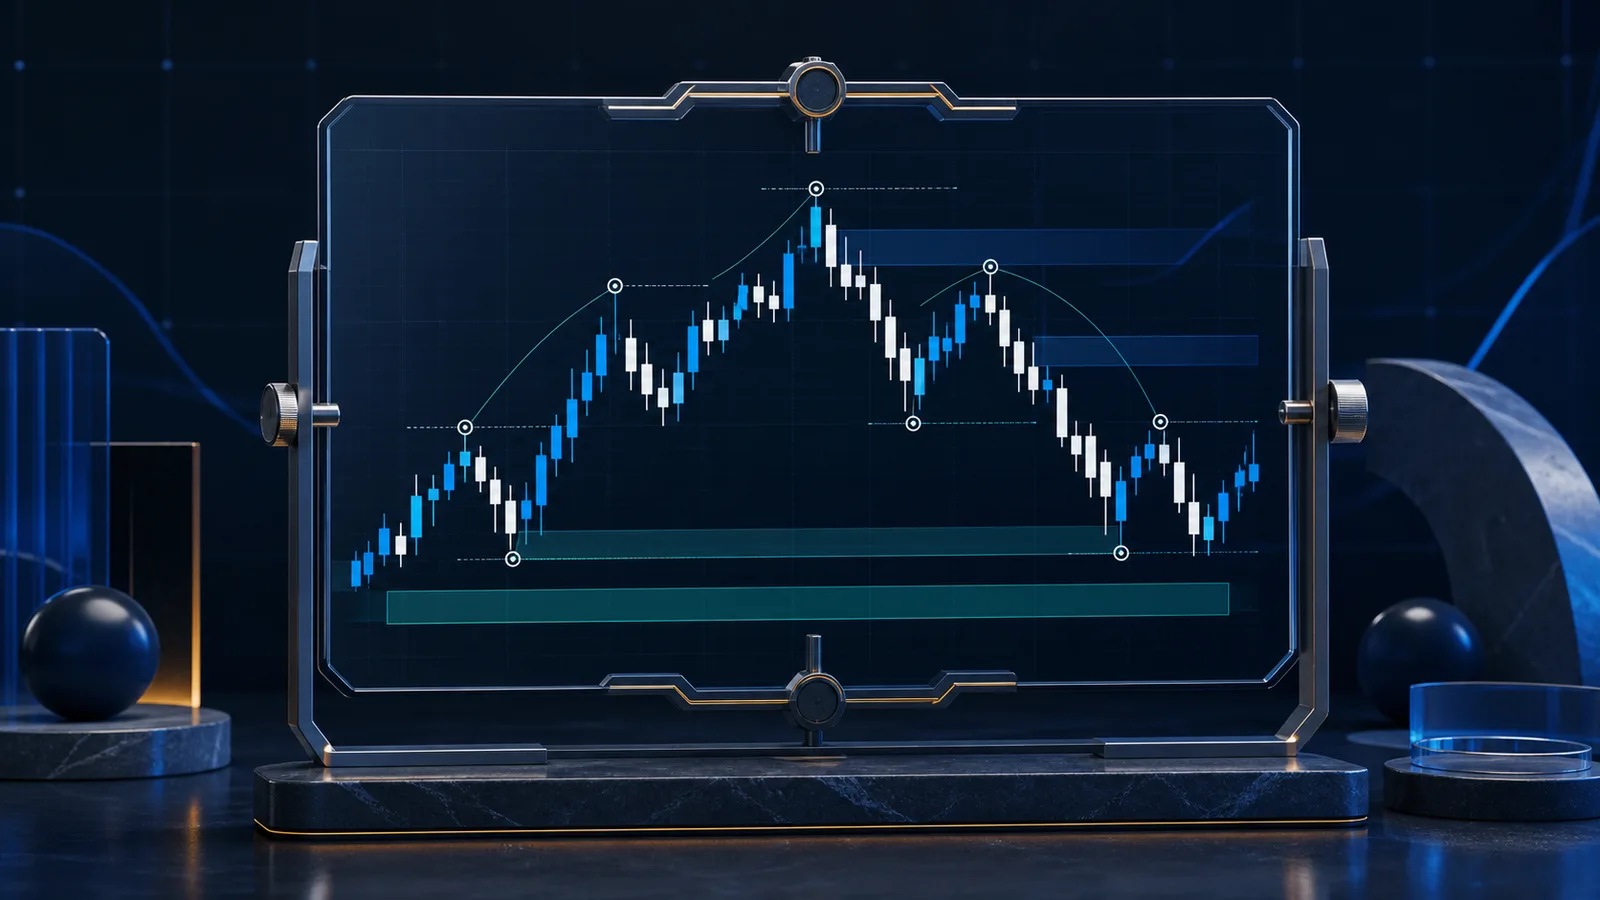
To evaluate a historical market analog responsibly, define the current setup before searching, compare information that was available at each historical match point, and study the complete range of paths that followed. The closest-looking chart is not automatically the most informative one. An analog is evidence that a similar configuration occurred before; it is not proof that price will repeat its next move.
A useful analog process therefore asks a narrower question: under clearly stated similarity rules, what happened across comparable historical cases, and how uncertain were those outcomes? That framing makes historical pattern matching a decision-support exercise rather than a prediction claim.
What a historical analog can—and cannot—tell you
A market analog is a past window that resembles a current window according to selected features. Those features might include normalized price shape, trend, volatility, drawdown, volume behavior, or the relationship between shorter and longer time frames. Normalization matters because a twenty-dollar move in one asset and a two-thousand-dollar move in another can have a similar percentage shape but very different market mechanics.
Similarity can reveal precedent. It can show that the present setup belongs to a broad family of historical conditions and can help researchers imagine more than one continuation. It cannot establish causation. Two charts may look alike while differing in liquidity, leverage, regulation, token supply, macro conditions, or a scheduled event. A matching silhouette does not mean that the forces behind it match.
A seven-part framework for evaluating analogs
- Write the present-tense query. Record the asset universe, bar interval, lookback length, features, normalization method, and search end time. Do this before inspecting any later historical data.
- Protect the information boundary. At each candidate date, calculate features only from observations that existed on or before that date. Accidentally using a centered indicator, revised dataset, or future high and low creates look-ahead bias.
- Define similarity explicitly. A visual impression is hard to audit. State whether distance is based on returns, levels rebased to 100, volatility-adjusted moves, correlation, or a combination. Each choice answers a different question.
- Inspect a neighborhood, not a winner. Review a reasonable group of near matches. If only the single closest analog is shown, an unusual continuation can dominate the story. Note whether the next-best cases broadly agree or immediately diverge.
- Control overlap and duplicates. Adjacent windows from the same rally can appear as many independent examples even though they represent one episode. Space match dates apart or group overlapping windows into events.
- Compare context separately. Label trend, volatility, liquidity, and any known event regime. Context should not be added after seeing the answer merely to rescue a preferred analog; decide in advance which filters are relevant.
- Summarize uncertainty. Show individual forward paths or a distribution with a median and quantile range. Record how many cases were included and test whether conclusions change when the lookback, match count, or distance rule changes modestly.
This framework complements a formal test rather than replacing one. For deeper treatment of time splits and data leakage, read Backtesting Chart Patterns: Common Biases and Better Tests.
Neutral worked example: a thirty-day crypto setup
Suppose a researcher wants to study a thirty-day pattern in a liquid crypto asset. Before searching, the researcher rebases each daily close to 100 at the start of its window, uses daily percentage changes for distance, requires candidate windows to end at least ninety days before the current date, and spaces historical matches forty-five days apart. The next fourteen days are reserved as the forward window and never contribute to similarity.
The search returns twelve historical episodes. Rather than publishing the most dramatic one, the researcher plots all twelve rebased forward paths, labels the volatility regime that existed at each match date, and reports the median, central range, and full range. Six paths rise at first, four fall, and two remain broadly flat in this hypothetical example. That mixture is the result: it argues for multiple scenarios, not a directional verdict.
The researcher then reruns the study with twenty-five- and thirty-five-day lookbacks. If the apparent conclusion reverses, it is fragile and should receive less weight. No trade is implied; the exercise simply maps how sensitive the historical comparison is to reasonable choices.
Turn analogs into decision-support scenarios
A disciplined review translates the distribution into conditional statements. What would confirm that the current path is behaving like the stronger group? What observation would invalidate that comparison? Which outcome was absent or rare in the sample but remains plausible today? Writing those questions before the next bar reduces the temptation to reinterpret the analog after the fact.
Use the crypto chart scenario review checklist to document those conditions. If you want a visual workspace for examining chart-pattern matches and possible future paths, explore AmarDeFi Chart Prediction. Its output should be treated as a research starting point to verify independently, not as a forecast or instruction.
Limitations that should remain visible
Historical samples are finite and crypto markets change. Older episodes may come from different exchange structures, liquidity conditions, participant mixes, or disclosure standards. Price and volume data can contain gaps, venue-specific anomalies, survivorship effects, and inconsistent symbol histories. A similarity score can also overemphasize whichever feature or time scale its designer selected.
Even a carefully constructed analog set describes only the cases present in the dataset. Rare shocks may be missing, and a narrow sample can create false confidence. Treat results as conditional on the data, definitions, and time period. Independent research, risk controls, and professional advice where appropriate remain outside the scope of a chart comparison.
Frequently asked questions
How many historical analogs should I review?
There is no universal number. Use enough cases to reveal dispersion without admitting clearly unrelated setups, disclose the count, and test nearby match-count settings. A conclusion that depends on exactly one cutoff is fragile.
Is the closest historical match the best forecast?
No. It is simply the closest case under one selected metric. Another metric, lookback, or normalization method may rank it differently, and its subsequent path remains one observation.
Should analogs come from the same crypto asset?
Same-asset comparisons preserve some market-specific traits but offer fewer independent episodes. Cross-asset comparisons expand the sample while adding structural differences. State the universe and analyze the two groups separately when possible.
Can historical analogs predict a price target?
They cannot establish a dependable target. Historical continuations can help define conditional ranges to investigate, but current context and future events can produce outcomes outside every observed path.
Editorial note: This article is general educational information, not personalized financial, accounting, tax, or legal advice. Product capabilities and obligations can change; verify current facts and consult a qualified professional where needed.